Construct IN
11 de jun. de 2024


Isis Gonzaga
Journalist

Optimize your team's results
One of the additional benefits of the Project Dashboard is being able to track how the team is using Construct IN and its various functionalities.
This is because it provides a summary of the main project information, such as the number of members, plants, points, notes, and RDOs created, as well as highlights on the captures made and the number of 360° images.
The dashboard also shows the average of accesses per day and user, listing the TOP 5 users who access the platform the most.
Thus, it is possible to have greater control over the use of the tool, ensuring the team's engagement and productivity, as well as deliveries on time.
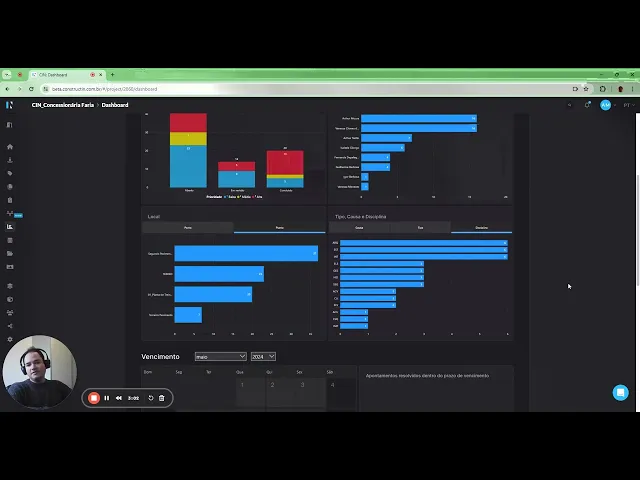
Check out the video below to learn in detail about all the possibilities of the Construct IN Dashboard:
Accelerate the management of your works
In summary, the Project Dashboard is one more tool from Construct IN that can transform the way you manage your works.
In addition to centralizing and providing quick access to the information you need, in an organized and integrated view, it allows you to make data-driven decisions, contributing to the success of the project.
If you want to accelerate the management of your works, be sure to test the remote monitoring platform in 360° and explore all its possibilities.
Try it for free by clicking here.


Optimize your team's results
One of the additional benefits of the Project Dashboard is being able to track how the team is using Construct IN and its various functionalities.
This is because it provides a summary of the main project information, such as the number of members, plants, points, notes, and RDOs created, as well as highlights on the captures made and the number of 360° images.
The dashboard also shows the average of accesses per day and user, listing the TOP 5 users who access the platform the most.
Thus, it is possible to have greater control over the use of the tool, ensuring the team's engagement and productivity, as well as deliveries on time.
Check out the video below to learn in detail about all the possibilities of the Construct IN Dashboard:
Accelerate the management of your works
In summary, the Project Dashboard is one more tool from Construct IN that can transform the way you manage your works.
In addition to centralizing and providing quick access to the information you need, in an organized and integrated view, it allows you to make data-driven decisions, contributing to the success of the project.
If you want to accelerate the management of your works, be sure to test the remote monitoring platform in 360° and explore all its possibilities.
Try it for free by clicking here.
Sobre o autor
Isis Gonzaga
Journalist
Jornalista com expertise em Marketing de Conteúdo e Produto, transformando conhecimentos de copywriting em estratégias e lançamentos de sucesso.
cOMPARTILHE NAS REDES
Recomendado para você
carregar mais ↓


Subscribe to our newsletter
Explore nossas soluções
Entre em contato e descubra como a captura da realidade e dados centralizados podem ser a solução para a gestão de suas obras.
